Tool Case Study: Ecosystem Mapping in the Anaheim Workforce Connection
Mapping services to streamline Anaheim’s workforce support pathways (by James Shirvell)
The CivicMakers Team led the inaugural Workforce Transformation Corps cohort, in partnership with Make Fast Studio, Jobs for the Future, California Workforce Association, Turning Basin Labs, and the James Irvine Foundation. This year-long learning and engagement program placed fellows in workforce development boards throughout the state of California to integrate human-centered design and equity-centered approaches into their organizations and their work with communities.
James was one of five Fellows in the Workforce Transformation Corps (WTC). He worked closely with the Anaheim Workforce Connection to increase the visibility and accessibility of workforce services.
Tool Application
I’ve always loved maps. Whether I’m exploring a new place or revisiting familiar ones, I often find that looking at a map unlocks new perspectives, connections, and layers of understanding. When I was placed in the Anaheim Workforce Connection (AWC) as a fellow, I was brand new to both the area and the local workforce development system. Mapping the ecosystem of services for job seekers felt like an ideal way for me to understand this new environment.
At this stage of the HCD process – the empathize stage – my focus was to learn more about how customers interacted with the AWC. Having experienced unemployment myself, I know how challenging it can be to navigate available resources and feel connected to support systems. 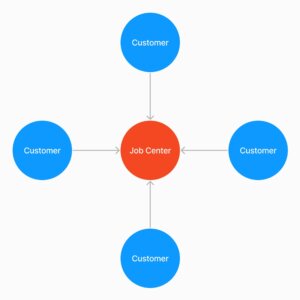
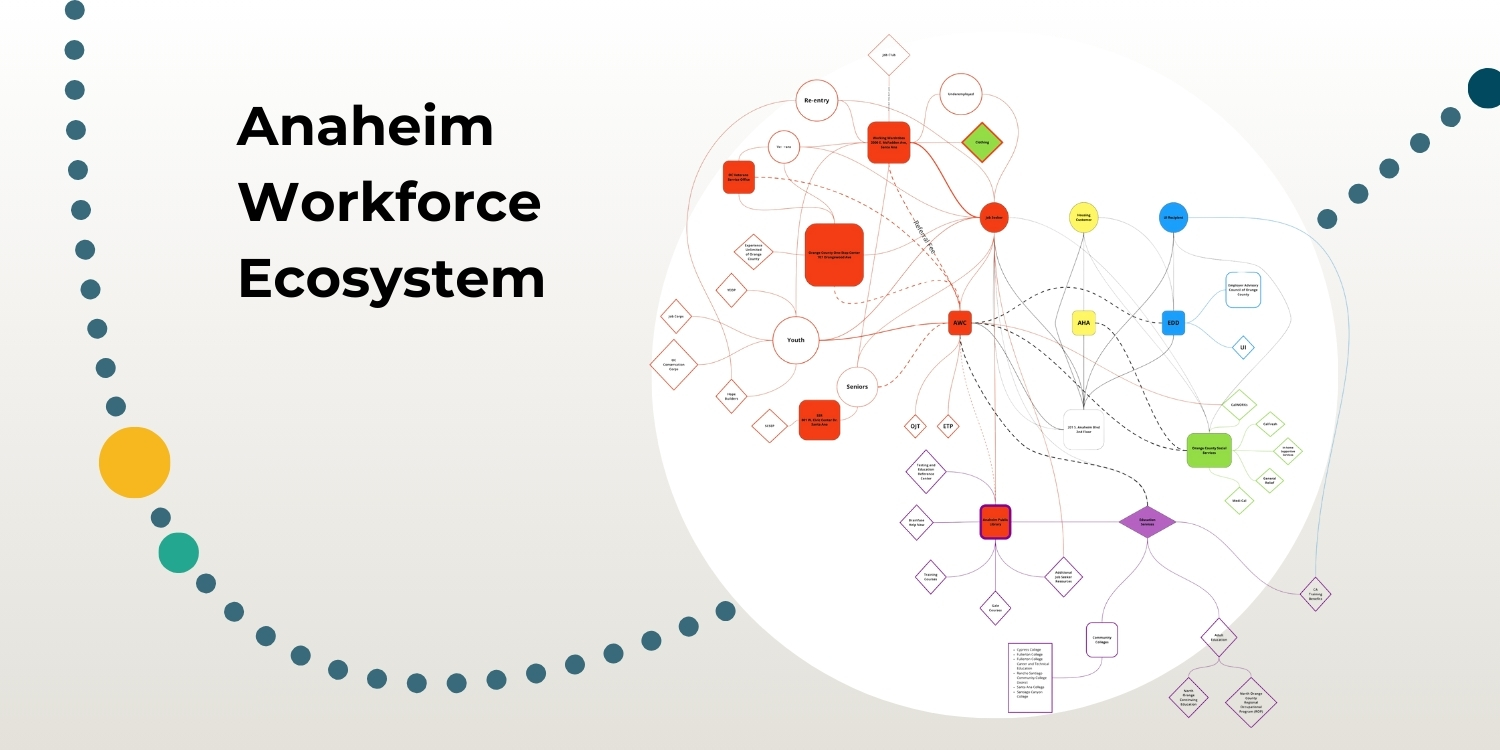
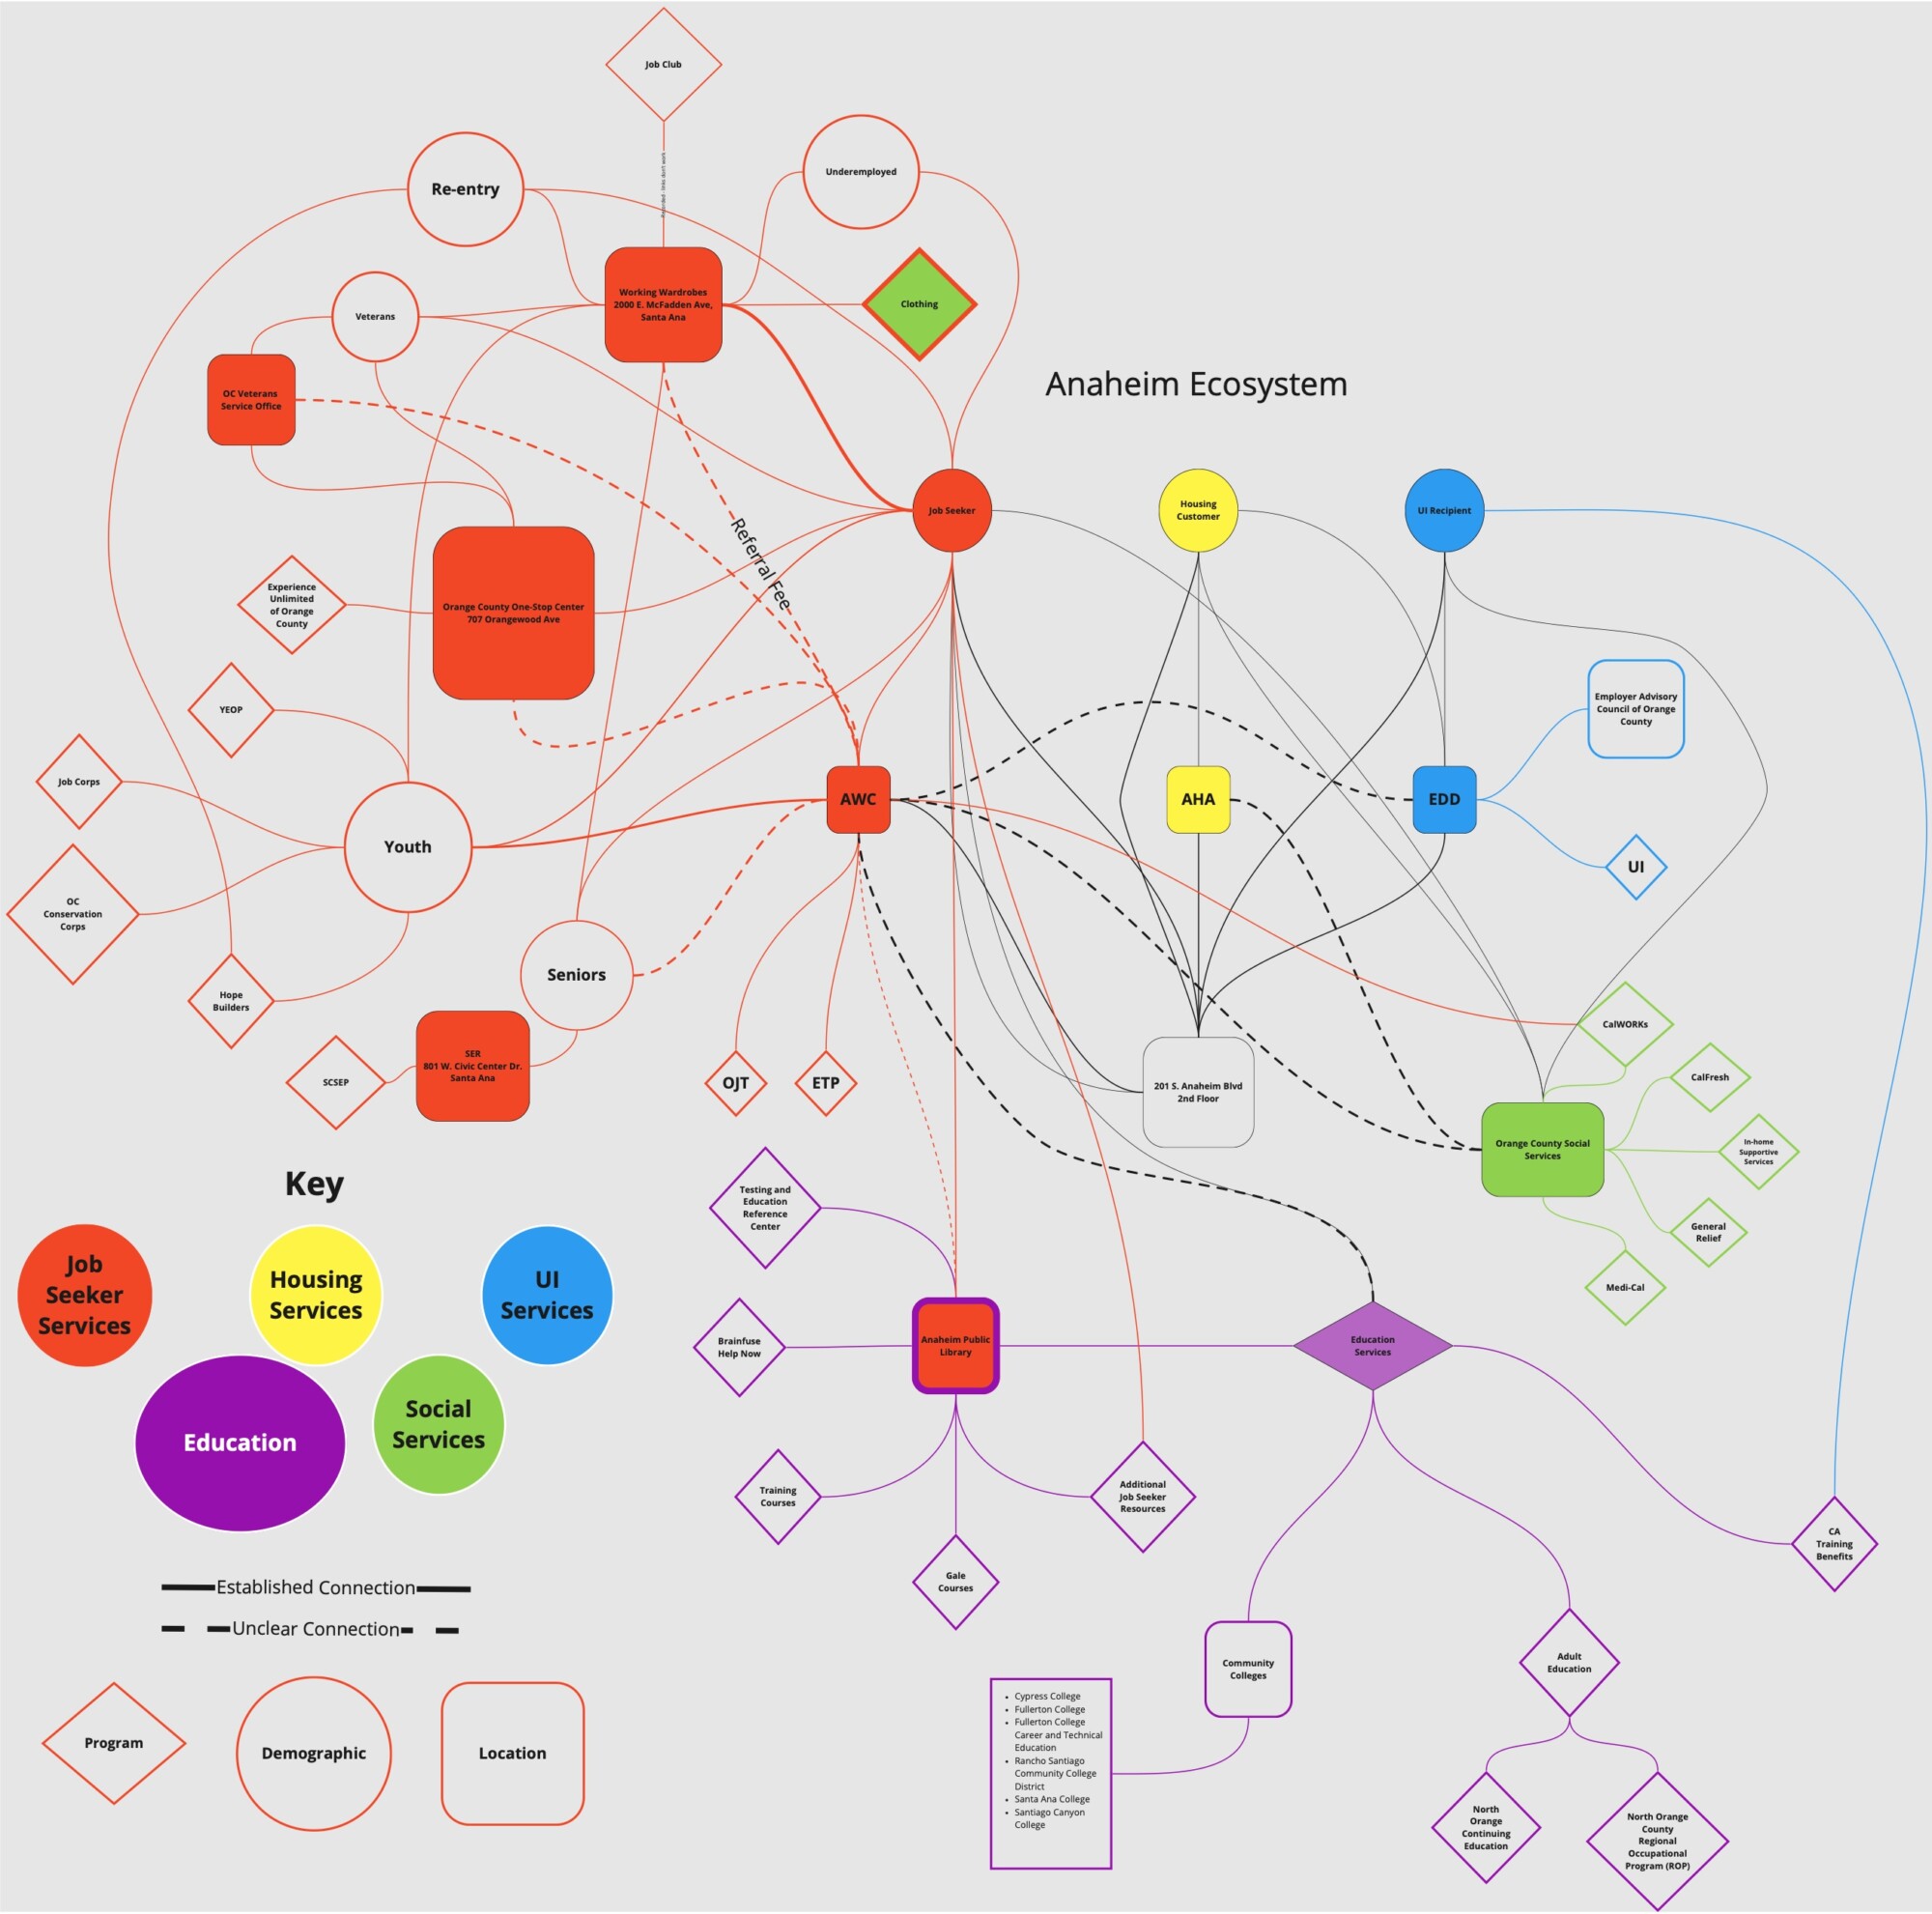
I initially approached the ecosystem map by placing the AWC at the center, as it seemed logical to map services outward from the organization I represented. However, as I spoke with customers and learned about their journeys, I started to encounter a series of “dead ends” in mapping from that perspective. Customers would share diverse experiences about where they’d come from before arriving at the AWC – some had previously engaged with housing services, while others had navigated the unemployment insurance (UI) process. They also described potential next steps that didn’t necessarily involve AWC services.
These stories revealed that the ecosystem wasn’t a simple, linear map – it was a web of interconnected services that a job seeker might engage with at different points. It became clear that to truly capture this web, I needed to recenter the map around the customer, not the AWC. This shift allowed me to focus on the full array of options, connections, and support systems – the interconnected touchpoints that a job seeker might encounter depending on their needs.
Visualizing the ecosystem map as a customer-centered web mirrored the thinking behind a journey map. Considering each potential path allowed me to plot out an inclusive array of services, envisioning the different routes a customer might take depending on their unique needs and goals.
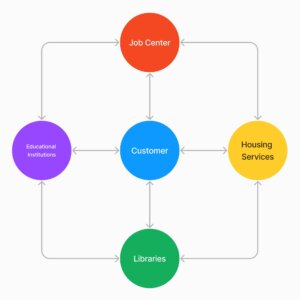 This approach created a map that was more versatile and reflective of the many possibilities available to them – not just within the AWC but across the broader support network. Through this, we could anticipate challenges or dead ends based on each customer’s unique starting point and service needs.
The ecosystem map proved effective in visualizing the complex network of services in a way that was clear and approachable. It helped us spot key moments where customers might feel lost in the system or become overwhelmed by choices. By mapping out these critical touchpoints, we could identify areas for improvement, whether through enhanced coordination among agencies or clearer communication about available services. Ultimately, the map served as a tool for understanding the system from the customer’s perspective and for identifying opportunities to improve access and support.
The Process
1. Observed Customer Interactions: Noted how job seekers navigated the AWC space and identified common behaviors and points of confusion.
2. Mapped Ecosystem from AWC perspective: Started with the AWC at the center, which provided a clear view of core services and highlighted direct resources available onsite, even though it revealed gaps in external connections.
3. Shifted to a Customer-Centered Approach: Refocused the map with the customer at the center, capturing a web of interconnected services based on customer needs.
4. Collected Customer Insights: Spoke with customers to understand their diverse journeys, including services accessed outside the AWC.
5. Visualized a Service Web: Mapped an interconnected network of services to represent multiple customer pathways and key touchpoints.
6. Identified Gaps and Opportunities: Highlighted areas where clear communication or stronger agency coordination could improve the customer experience.
Recommendations
- Center the customer early on: starting with the customer’s journey, rather than the organization’s structure, can reveal more relevant pathways and interconnections. Mapping from the AWC perspective was helpful as a foundation, but ultimately centering the customer streamlines the process and yields deeper insights.
- Collaborate across agencies: Engaging with staff from different services enriched the map and highlighted areas for potential collaboration. Building in collaboration early would strengthen connections between services and create a more seamless experience for customers.
- Embrace Iteration and Regular Updates: The mapping process is ongoing and requires constant refinement. By regularly refreshing the map based on customer feedback and evolving services, we can ensure it remains relevant and effective in meeting the needs of job seekers.
Author
James Shirvell
Program Manager of EnergyWorks, The WorkPlace

Originally from Mystic, Connecticut, James is the inaugural Program Manager of EnergyWorks. EnergyWorks is a workforce development initiative funded through the Bipartisan Infrastructure Law and managed by The WorkPlace, the southwestern Connecticut Workforce Development Board.
Previously, James served as the Workforce Transformation Fellow for the Anaheim Workforce Connection through the Workforce Transformation Corps, where he gained valuable experience in workforce development and practiced human-centered design. In his current role, James facilitates the creation of career pathways in the clean energy and utilities sectors for Connecticut residents, advancing climate action with a focus on equity and access to opportunity.
With an academic background in environmental studies, James found a career path dedicated to creating and expanding opportunities for individuals. His own experience with unemployment deepened this path, shaping his approach to workforce development. James is committed to providing equitable access to opportunities for all individuals, recognizing that different people require different resources and support to reach their goals. By understanding and responding to those needs, he works to ensure that everyone has the tools they need to thrive, regardless of their starting point or background.
